Next-Gen Data Analysis with R and AI-Powered RAISINS: 7-Day Training
Unlock advanced agricultural data analytics with R and elevate your research and professional skills.
Dates: December 5–11, 2025 (Online)
Timing: 7:00 PM – 8:30 PM IST daily
For: Researchers, students, and professionals in agriculture and allied science.
Certificate Provided | Live Q&A
Training Schedule
December 5–11, 2025 | 7:00 PM – 8:30 PM IST daily
| Day | Topics |
| Day 1 Getting Started |
Getting Started with R and RAISINS Introduction to R: installation, setup, and basic workflow Guided live document for smooth installation and orientation Exploring RAISINS: overview, navigation, and capabilities |
| Day 2 Foundations |
Foundations of Experimental Design and Analysis Principles of design of experiments (DOE) Creating experimental layouts in R and RAISINS Analysis of experimental data and interpretation of results |
| Day 3 Relationships |
Statistical Relationships and Modelling Descriptive statistics and data summarization Correlation and regression analysis (simple and multiple) Introduction to logistic regression and interpretation in research contexts |
| Day 4 Multivariate |
Multivariate Exploratory Techniques Introduction to exploratory data analysis in agriculture and allied fields Principal Component Analysis (PCA): concepts and applications Cluster analysis and factor analysis: grouping and latent variable discovery |
| Day 5 Advanced Designs |
Advanced Designs in Agricultural Research Factorial experiments: concepts, layout, and interpretation Split-plot and strip-plot designs: when and how to use them Practical demonstrations with real datasets |
| Day 6 Genetics |
Statistical Genetics and Advanced Techniques Introduction to statistical genetics Path analysis and stability analysis for genotype evaluation Variance components and heritability estimation |
| Day 7 Visualization |
Data Visualization and No-Code Analytics Best practices in data visualization for agricultural research Generating impactful graphs and plots in R Leveraging RAISINS for no-code data analysis and visualization |
December 2025 - Training Days:
SunMonTue
WedThuFriSat
1 2 3 4
5
6
7
8
9
10
11
12 13 14 15 16 17 18
19 20 21 22 23 24 25
26 27 28 29 30 31
×
Topic:
Trainer:
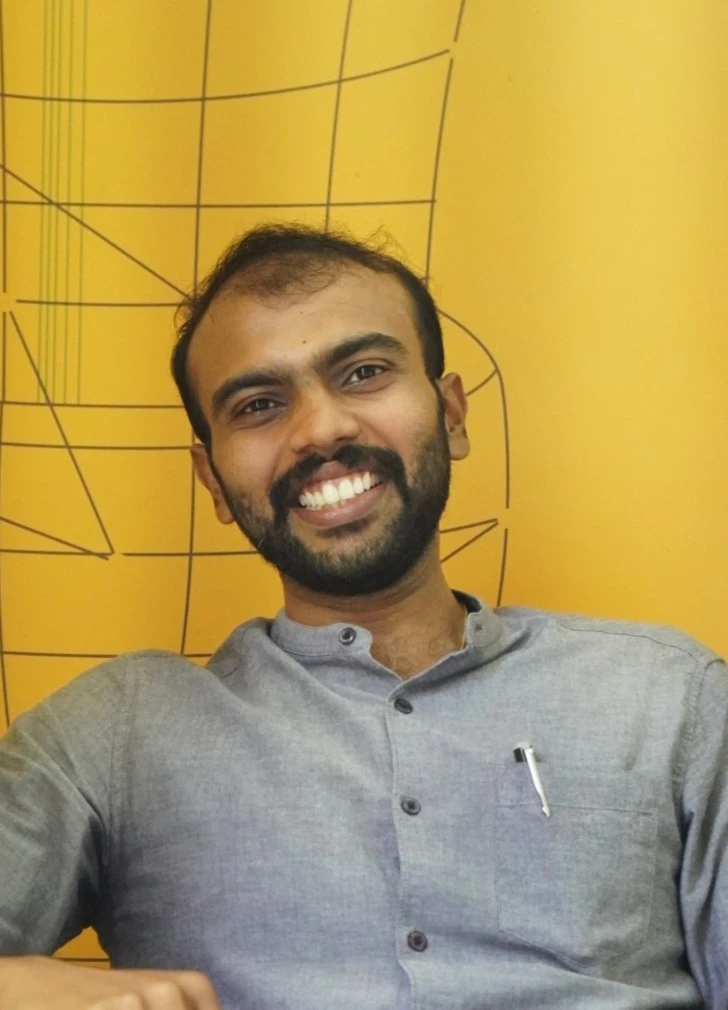
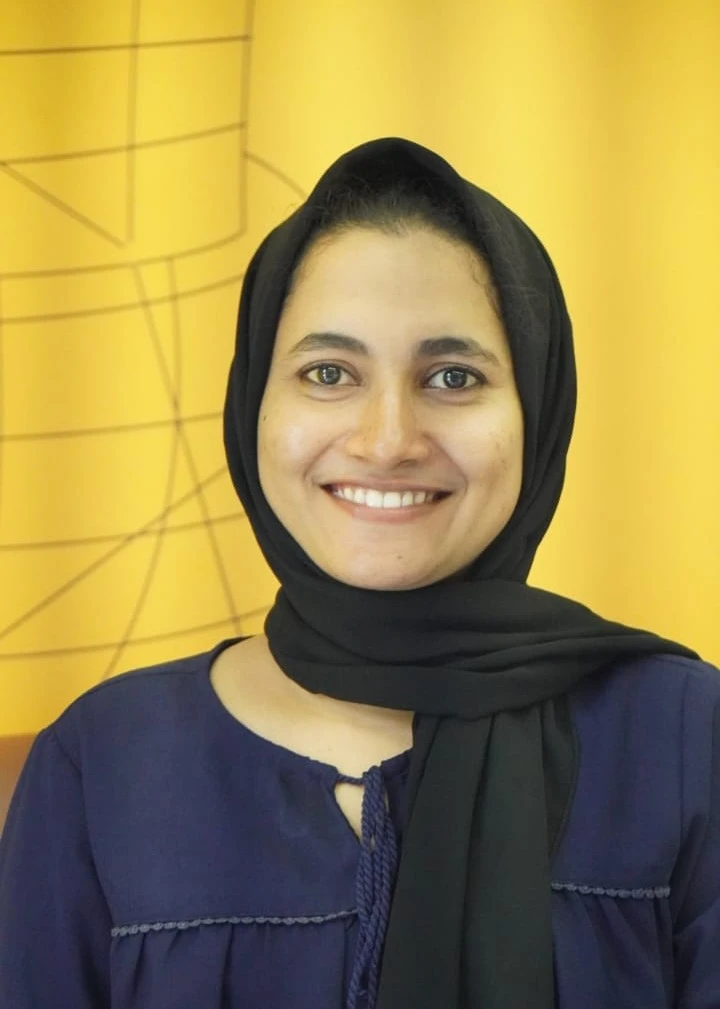
Meet the Trainers

Dr. Adarsh V S
Assistant Professor, Department of Agricultural Statistics.

Mohammed Hisham M
CTO and Co-founder, STATOBERRY LLP, PhD Agricultural Statistics

Arshida A K
Data Scientist, STATOBERRY LLP
Invited Speaker

Dr. Pratheesh P Gopinath
Assistant Professor and Head, Department of Agricultural Statistics, College of Agriculture, Vellayani, Kerala Agricultural University

Dr. Manju Mary Paul
Assistant Professor, Department of Agricultural Statistics, College of Agriculture, Vellayani, Kerala Agricultural University
Frequently Asked Questions
Do I need prior experience in R?
No. Day 1 begins with R basics—beginners are welcome.
Will I get training materials?
Yes, all datasets, slides, and scripts will be shared post-session.
Can I attend online?
Yes, the full program is online/virtual.
How do I get my certificate?
Certificates will be provided through the dedicated training platform.